GSW Series vs Guide FA611S: Which Acoustic Imaging Camera to Buy
Both cameras put a 640×512 thermal detector behind a MEMS microphone array, so the buying decision is not “acoustic versus thermal”. It sits in three published numbers — acoustic bandwidth, array size and IR sensitivity — plus the screen you will actually read in a plant. This comparison is written from the quotation desk: what each figure changes on site, which jobs each camera suits, and the questions to settle before you compare two prices.
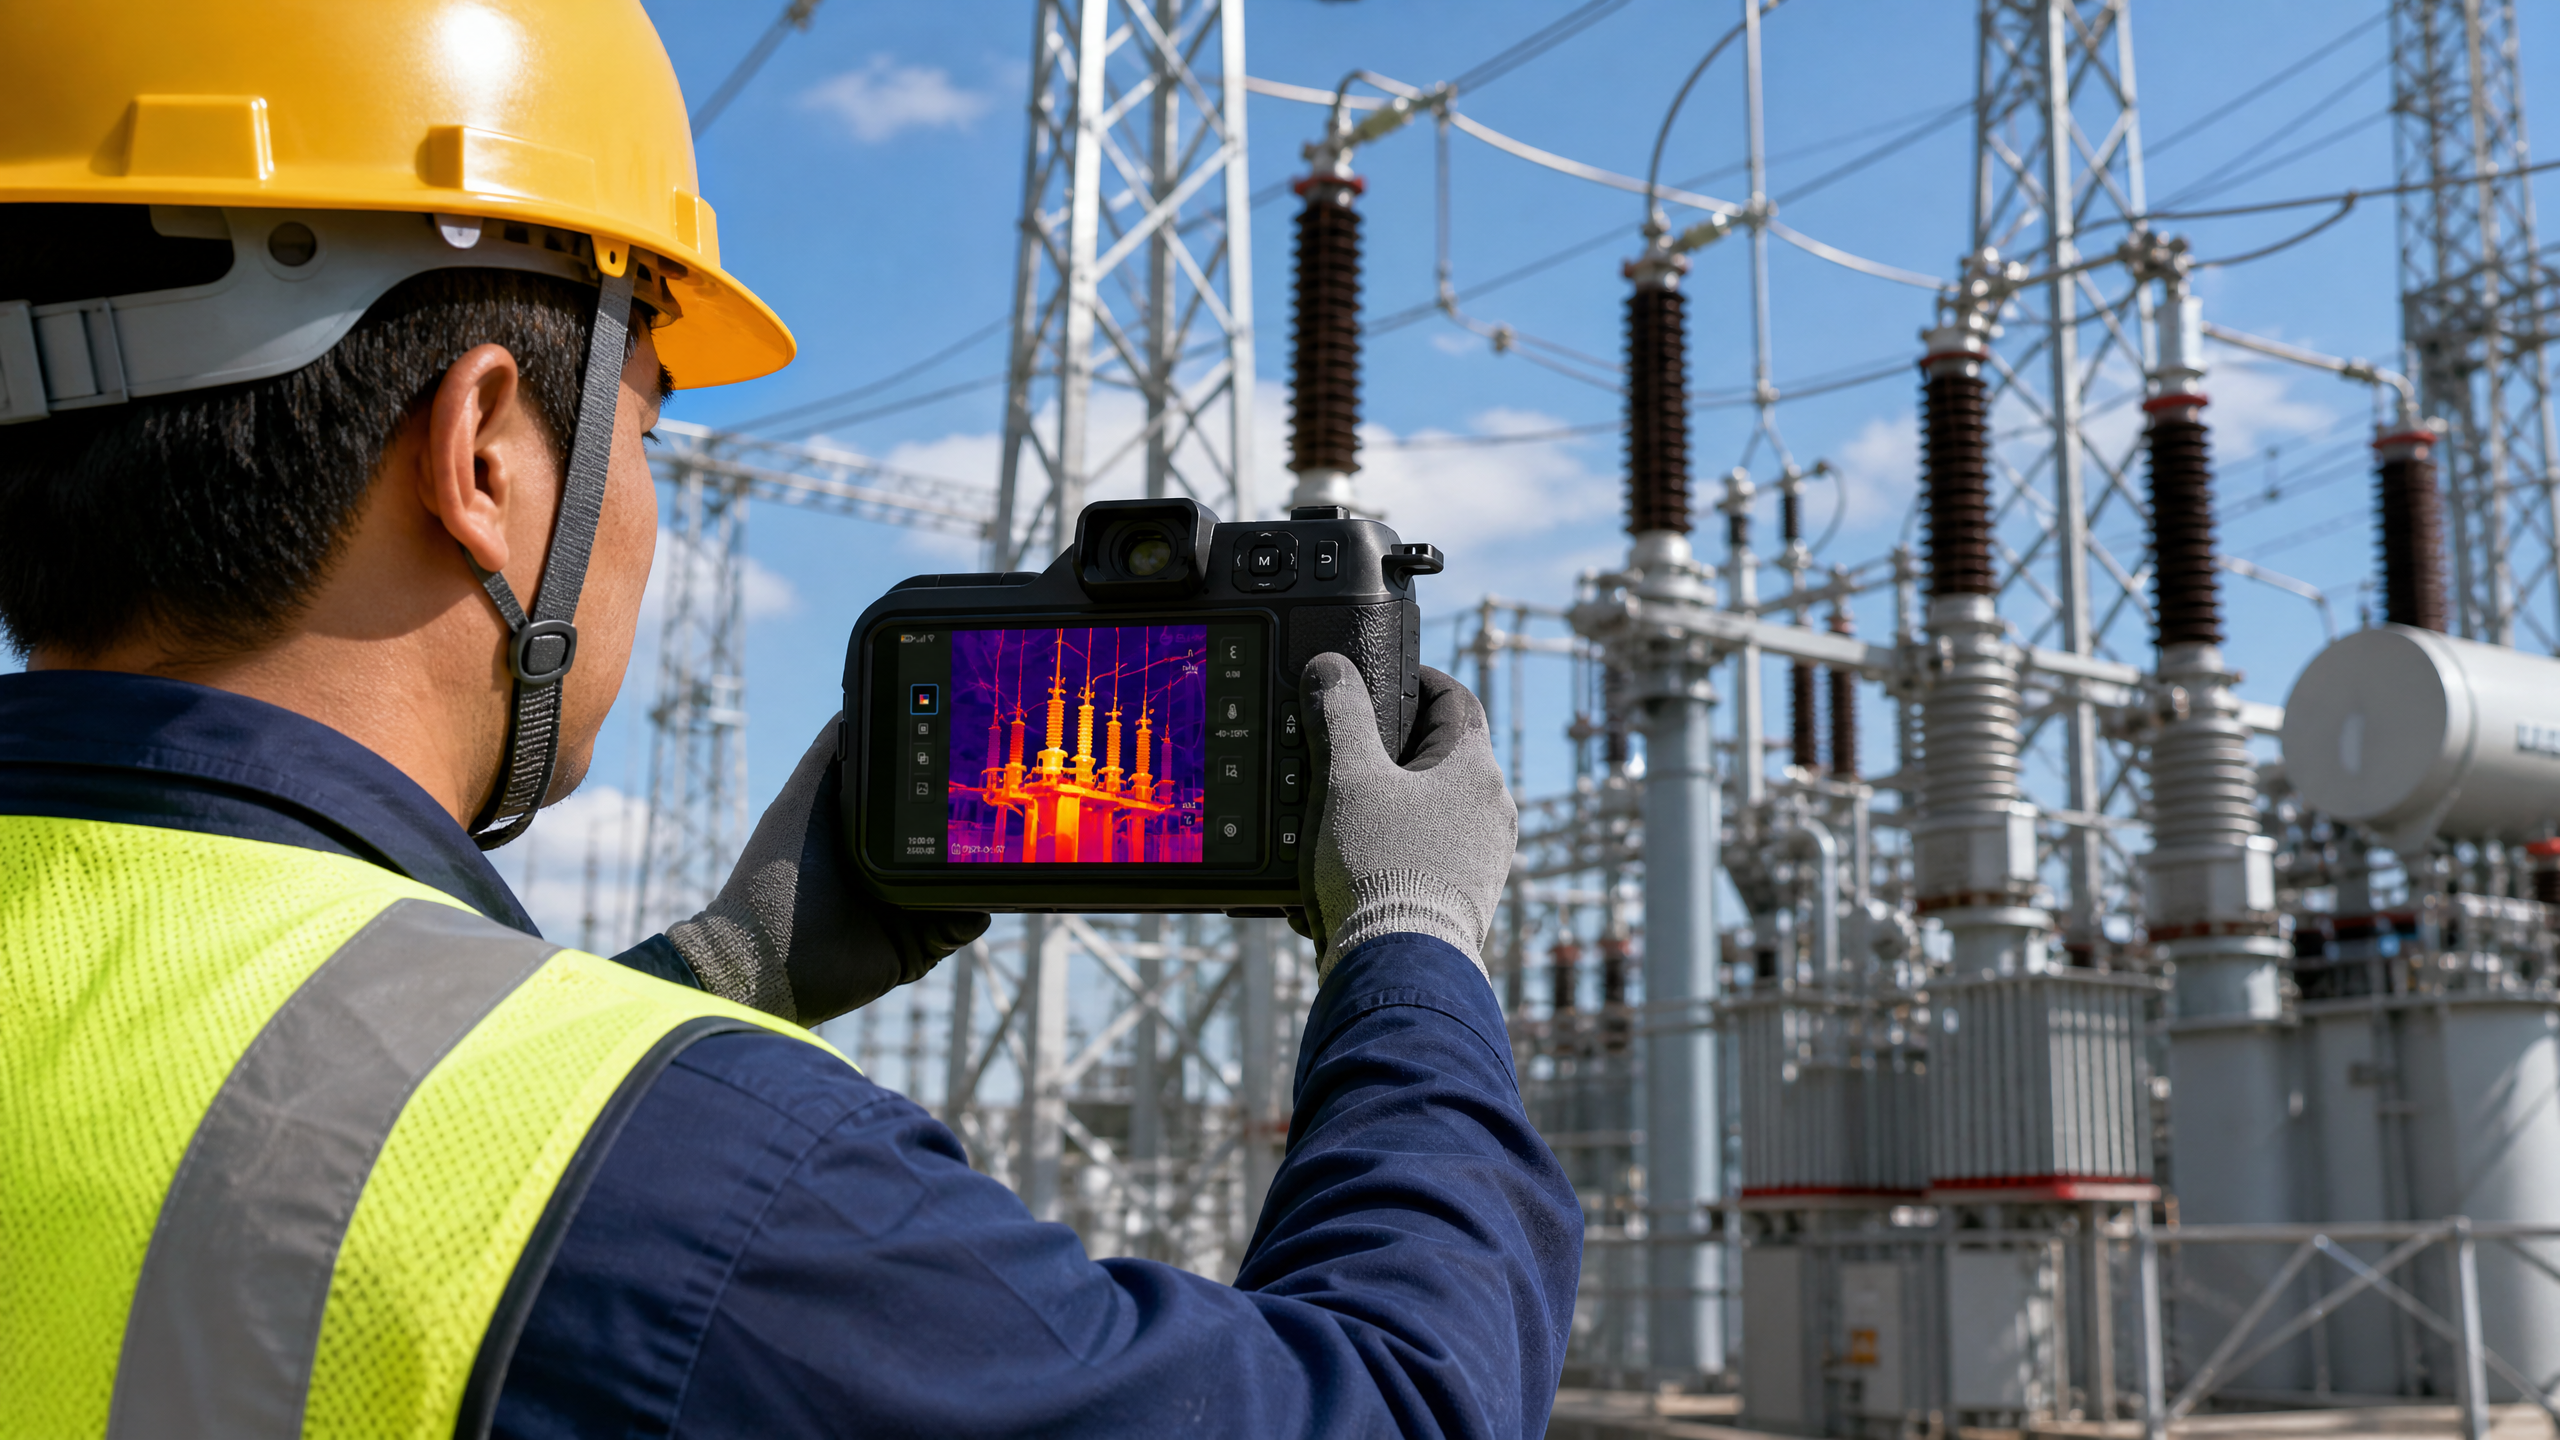
When a maintenance team narrows an acoustic imaging camera purchase down to two models, the comparison usually stalls on microphone count. That number is the least interesting difference between the GSW Series and the Guide FA611S. Both carry a 640×512 thermal detector. Both localise airborne ultrasound on a visible-light image. What separates them is the acoustic bandwidth they digitise (2–100 kHz against 0–65 kHz), the array that does the beamforming (136 silicon microphones against 128 MEMS), the thermal sensitivity of the IR channel (40 mK against 20 mK) and the display you will hold between you and the switchboard (a 10.1″ tablet against a handheld body).
This article compares those differences using only the specification values published for each model, and states plainly where a value is not published rather than filling the gap. Prices for both are quotation-based and move with configuration, so the last section is about how to make two offers comparable instead of how to guess a number.
- The Short Answer
- What the Two Cameras Have in Common
- Specification Table
- Bandwidth: 2–100 kHz vs 0–65 kHz
- The Array: 136 vs 128 Microphones
- The IR Channel: 40 mK vs 20 mK, +410 °C vs +650 °C
- Screen, Ranging, Battery, Reporting
- Which Camera Fits Which Job
- Price, Rental and How to Read Reviews
- What to Send for a Quotation
- Five Mistakes in This Purchase
- Frequently Asked Questions
- Verdict
The Short Answer
If the job is compressed-air, steam and vacuum leak surveys in a noisy plant, the GSW Series is the stronger instrument: its acoustic band runs to 100 kHz, which means a shorter wavelength, a narrower beam and less competition from the low-frequency machinery noise that dominates most industrial sites, and its 40 m laser ranging with ±1 cm accuracy turns “somewhere up there” into a measured distance you can put in a leak report.
If the job is electrical inspection where the thermal image carries the finding — loaded panels, busbars, cable terminations, motors — the Guide FA611S is the more comfortable instrument: its IR channel is quoted at ≤20 mK with a −20 °C to +650 °C range, and its 10.1″ 1920×1200 touchscreen is the largest display in this class, which matters when two people review a thermal pattern in front of an open cubicle.
Both are acoustic-plus-thermal instruments. Neither replaces a dedicated partial-discharge detector for internal discharge: if your asset list includes cable joints, transformer windings or GIS compartments, the method you need is HFCT, UHF or AE, and that is a HPD500 conversation rather than an acoustic camera conversation.
Choose the acoustic camera by the band it digitises and the distance it can measure, and choose the thermal channel by the NETD and range it publishes. Microphone count is the third question, not the first.
What the Two Cameras Have in Common
Starting with the shared ground keeps the comparison honest. Both models are all-in-one instruments: a MEMS microphone array for airborne ultrasound, a 640×512 infrared detector for temperature, and an overlay that places the acoustic hotspot or the thermal anomaly on a visible-light image so the operator can see where to point next. Both are quoted for the same four families of work — compressed air and gas leaks, steam traps and valves, vacuum systems, and partial discharge in air-insulated electrical equipment. Both are IP54 in the published specification.
That overlap is why this is a configuration decision rather than a category decision. You are not choosing between two technologies. You are choosing which of two implementations of the same technology matches the survey you actually run, the noise environment you run it in, and the report you have to hand over afterwards.
Specification Table
Values below are taken from the current published specifications for each model. Where a field is not published, the table says so; that is a procurement question to raise in the quotation, not a gap to be filled by assumption.
| Specification | GSW Series (acoustic + thermal) | Guide FA611S (acoustic + thermal) |
|---|---|---|
| Microphone array | 136 digital silicon microphones | 128 low-noise MEMS microphones |
| Acoustic bandwidth | 2 – 100 kHz | 0 – 65 kHz, adjustable |
| Detection distance (published) | 0.3 – 130 m | 0.3 – 100 m |
| IR resolution | 640 × 512 | 640 × 512 @ 12 µm |
| Thermal sensitivity (NETD) | < 40 mK @ 30 °C | ≤ 20 mK |
| IR temperature range | −20 to +150 °C / 0 to +410 °C | −20 to +650 °C |
| IR accuracy | ±2 °C or ±2 % of reading | Not published — confirm per quotation |
| Spectral range | 8 – 14 µm | 8 – 14 µm class (not itemised) |
| Laser ranging | 40 m, ±1 cm or 1‰ | Not published — confirm per quotation |
| Display | Not published — confirm per quotation | 10.1″ LCD touchscreen, 1920 × 1200 |
| Super resolution | 4× pixel enhancement (software) | Not stated |
| Battery life | Not published — confirm per quotation | Up to 4 hours |
| Ingress protection | IP54 | IP54 |
| Fusion display | Real-time acoustic + thermal fusion | Real-time acoustic + thermal overlay |
Two rows in that table are routinely misread, so they are worth stating before the sections that follow: a detection-distance figure is published without a stated leak size, pressure and background-noise level, and a NETD figure is quoted at a stated ambient temperature. Both are comparative indicators between models, not promises about a specific leak in a specific plant.
Bandwidth: 2–100 kHz vs 0–65 kHz
This is the single most consequential difference, and it is also the one buyers ask about least. Acoustic imaging localises sound by comparing arrival times across the array, and the spatial resolution of that localisation scales with wavelength. In air at 20 °C, sound travels at roughly 343 m/s, so the wavelength is about 17 mm at 20 kHz, 8.6 mm at 40 kHz and 3.4 mm at 100 kHz. A band that reaches 100 kHz gives the beamformer a shorter wavelength to work with at the top of its range.
The second consequence is noise. Most plant noise — motors, fans, ventilation, pumps, conveyors — is concentrated at low frequency. A small pressurised leak, by contrast, radiates broadband energy well into the ultrasonic region, and the smaller the leak, the more of its energy sits at high frequency. A camera whose upper band is 100 kHz can therefore be tuned into a region where the background is quieter and the leak is comparatively louder. A 65 kHz ceiling is not a defect; it is simply a lower roof, and on a large leak in a quiet area the two cameras will look identical.
The lower edge matters too, in the opposite direction. The GSW starts its band at 2 kHz, which deliberately excludes the audible rumble that dominates a compressor room. The FA611S starts at 0 kHz and is adjustable, which keeps the audible band available — useful for mechanical diagnosis and for locating a source by ear-assisted cross-check, at the cost of admitting more machinery noise into the image when the band is opened up. Neither choice is wrong; they serve different survey habits.
If your leak surveys happen in a compressor room, a bottling line or any plant where you have to hunt for a 1 mm orifice against running machinery, buy bandwidth. If your surveys happen on a quiet roof or in a substation yard, bandwidth is a bonus rather than the deciding factor.
The Array: 136 vs 128 Microphones
136 against 128 is an eight-microphone difference, roughly six percent. It is not the reason to choose either camera, and any supplier who leads with microphone count is steering the conversation away from the numbers that matter. What does matter is the aperture and geometry of the array, because beam width depends on array size relative to wavelength, and side-lobe behaviour depends on how the elements are distributed. Those properties are not published for either model, which is exactly why the honest way to compare two arrays is a live demonstration on a known leak at a known distance, not a datasheet duel.
What the published detection distances do tell you is the manufacturer's own claim about usable range: 0.3–130 m for the GSW, 0.3–100 m for the FA611S. Treat the upper figure as the distance at which the array can still place a source in the image under favourable conditions, and treat it as indicative. A 30 m figure that was established with a large leak in a quiet yard does not transfer to a 0.5 mm orifice beside a running chiller. What does transfer between sites, and what you should test in a demonstration, is repeatability: can the camera find the same leak twice, from two angles, at the distance you actually work at?
For buyers who already own a thermal camera and only need the acoustic channel, the acoustic-only arrays in the same family are the rational purchase: the SW136 carries the same 136-microphone, 2–100 kHz array and 0.3–130 m range in an 800 g handheld with a 5″ 800×480 display and over two hours of battery, while the SW234 steps to a 234-microphone array with a 0.3–200 m range, GPS and Wi-Fi/4G. Paying for an IR channel you already own is the most common way to overspend in this category.
The IR Channel: 40 mK vs 20 mK, +410 °C vs +650 °C
The two thermal channels are the same size and not the same instrument. Both detectors are 640×512, so both resolve the same number of temperature points across the same field of view. The difference is sensitivity and range.
The GSW is quoted at <40 mK at 30 °C; the FA611S at ≤20 mK. NETD is the temperature difference a detector can resolve against its own noise floor, and lower is better. In practice a 20 mK channel will show a faint temperature difference on a lightly loaded panel that a 40 mK channel renders as texture. That is not a small advantage in electrical inspection, because the interesting faults on a lightly loaded system are small temperature differences: a slightly resistive joint at 15 % load is exactly the case where a 40 mK camera starts to argue with you and a 20 mK camera does not.
The range difference runs the other way for process work. The GSW publishes −20 to +150 °C and 0 to +410 °C; the FA611S publishes −20 to +650 °C. For distribution and industrial electrical equipment, 410 °C covers essentially every realistic fault you will image; for steam lines, process heaters or mechanical equipment, 650 °C extends the usable range before you need a higher-temperature configuration. Neither specification includes a high-temperature option in the published table, so if your asset list includes furnaces or kilns, say so in the enquiry.
One honest note on the 4× super-resolution figure published for the GSW: it is a software enhancement of the displayed image, not four times the detector pixels. It improves the readability of a small target on screen; it does not change the physical sampling of the scene. Buy it as a display feature.
Screen, Ranging, Battery, Reporting
The FA611S is built around a 10.1″ 1920×1200 touchscreen, which is tablet-sized and the reason the instrument reads as a two-handed device. That display is a genuine workflow advantage when a finding has to be reviewed and agreed on site — a supervisor, a contractor and an operator looking at the same thermal pattern, with the acoustic overlay visible at arm's length. It also makes on-screen annotation and menu work faster, which shortens the per-asset time on a long walkdown. The published battery figure is up to four hours.
The GSW publishes its laser ranging and accuracy — 40 m at ±1 cm or 1‰ — and not its display or battery life. Ranging is underrated in leak work: distance is what converts an acoustic reading into a defensible statement about where the leak is, and it lets you report a leak at “6.4 m, north face, second flange” rather than “high up on the header”. If your deliverable is a leak register with repair priorities, that is worth more than a larger screen. Display size and battery life for the GSW must be confirmed in the quotation, and a demonstration is the place to judge whether the screen is readable in daylight.
Reporting is where both instruments are judged after the survey. Ask each supplier for a sample export before you order: which file formats leave the instrument, whether the acoustic image and the thermal image can be exported separately as well as fused, whether a measurement (dBµV, distance, temperature) can be attached to each finding, and whether the analysis software licence covers every engineer who will use the camera or only the first seat. A camera that produces findings your asset-management system cannot accept becomes a camera that produces photographs.
Which Camera Fits Which Job
| Job you actually run | Deciding requirement | Model that fits |
|---|---|---|
| Compressed-air leak survey in a running plant | High acoustic band, distance measurement, fusion overlay | GSW Series |
| Steam trap and valve survey | Bandwidth plus a thermal range that reaches process temperatures | Both — FA611S if temperatures exceed 410 °C, GSW if you want the higher band |
| Loaded LV/MV panel and busbar thermal survey | Low NETD on a lightly loaded system, large review screen | Guide FA611S |
| Air-insulated switchgear and outdoor structure PD screening | Airborne-acoustic localisation of surface discharge and corona | Both — the acoustic channel does the work here |
| Internal PD in cable joints, transformers or GIS | HFCT, UHF or AE method coverage | Not an acoustic camera — see HPD500 |
| Team already owns a thermal camera | Acoustic localisation only, lowest cost of entry | SW136 or SW234 |
The row that catches buyers out is the third from the bottom. An acoustic camera is excellent at finding discharge that has an acoustic path to the air — corona on a bushing, tracking across a polluted insulator, loose hardware arcing in air. It is the wrong instrument for a void inside a cast-resin joint, because the sound never reaches the microphone in a usable form. Teams that buy one acoustic camera expecting it to cover the whole PD programme end up buying a PD detector eighteen months later. If you want the decision framework for that second purchase, the HPD200 versus HPD500 comparison covers the method coverage question asset by asset.
Price, Rental and How to Read Reviews
Neither model has a public list price, and a supplier who gives you one on a first email is usually quoting a configuration he has not yet confirmed. What moves the price between two offers for “the same” acoustic imaging camera is a short, boring list, and it is the list you should compare line by line:
Array and band. Microphone count and the upper frequency limit are the two most expensive acoustic decisions in the bill of materials. A 136-element array with a 100 kHz band is a different instrument from an entry array, even when the cases look alike.
IR channel. 640×512 with ≤20 mK costs more than a smaller or less sensitive detector. Ask which detector and which NETD the quoted configuration actually carries, because series names do not always pin it down.
Display and enclosure. A 10.1″ 1920×1200 tablet-class screen, its touch layer and its power budget are a visible share of the cost. That is the honest reason the FA611S sits in a different bracket from a 5″ handheld.
Software seats and reporting. Analysis software licences, export formats and per-seat terms are the line most often left out of a first quotation and added later.
Accessories, calibration and paperwork. Extra batteries, chargers for your voltage, a hard case, a calibration certificate, and neutral packaging or your own branding if you resell. Neutral packaging is available on these models, with the exact terms confirmed by model, quantity and order confirmation.
When renting is the right answer
A camera like this earns its price through repeat surveys. If you have a single compliance round, a one-off energy audit or a project with a defined end date, renting converts a capital purchase into a project cost with no calibration or software-licence obligation afterwards. Check four things in any rental agreement: the calibration status and date of the unit you will receive, the condition and channel count of the microphone array (a damaged element degrades the image in ways that are easy to miss), whether the analysis software licence travels with the rental, and whether training is included or charged. A cheap weekly rate with no training is usually the more expensive rental.
How to read reviews without being misled
Published reviews of acoustic cameras share one systematic weakness: a screenshot of a bright acoustic hotspot says nothing about the conditions that produced it. Before you weight a review, look for the leak size, supply pressure, working distance, background noise and frequency band used. Absent those five numbers, a review is a photograph of a screen. The reviews that are worth reading describe the workflow — how long the battery lasted on a real walkdown, how readable the screen was outdoors, how long the export took — because those are the parts a datasheet cannot tell you and a demonstration will only partly show.
What to Send for a Quotation
Two acoustic camera offers can differ by a large factor and still both be “competitive”, because they are rarely scoped to the same thing. Send these eleven items and the comparison becomes arithmetic instead of impression:
1. The survey type — compressed air, steam, vacuum, gas, electrical PD, or a mix, with the approximate share of each. 2. The asset list, by equipment family and voltage level where relevant. 3. Typical working distance and whether you need to inspect from ground level or at height. 4. The background-noise environment, described concretely (compressor room, quiet substation yard, production hall). 5. The smallest leak or defect you must be able to find, if you know it. 6. Whether the thermal channel must reach process temperatures above 410 °C. 7. The deliverable — a leak register, a thermal survey report, a PD screening log, or an asset-management import. 8. How many engineers will use the camera and the analysis software. 9. Whether you need neutral packaging or your own branding. 10. The certification and calibration documents your import or client process requires, by type. 11. Quantity, destination country and required delivery window.
Ask for the sample export file and the calibration document alongside the price. Certification documents are available for these models, but the exact certificate type, standard and report number are confirmed per model and per quotation — that is the accurate way to state it, and any supplier who claims a blanket certificate across a whole series is telling you something about his paperwork rather than his product.
Five Mistakes in This Purchase
1. Buying microphone count instead of bandwidth. 136 against 128 is noise in the decision. The band edge and the array aperture are what change what you can find.
2. Assuming a detection-distance figure is absolute. Published range is indicative and depends on leak size, pressure and background noise. Ask for the conditions behind the number, or test it yourself on a known leak.
3. Buying the IR channel twice. If your team already walks the plant with a thermal camera, an acoustic-only array covers the new capability at a lower cost of entry.
4. Expecting one acoustic camera to cover internal PD. Cable joints, transformer windings and GIS compartments need HFCT, UHF or AE. Budget for that separately, or accept the gap knowingly.
5. Comparing quotations without a scope. Software seats, calibration paperwork, batteries and packaging are where two offers diverge. Compare the eleven items above, not the bottom line.
Frequently Asked Questions
Is 136 microphones better than 128? Marginally, and not in a way that should decide the purchase. Beam width depends on the array aperture relative to wavelength, and side-lobe behaviour depends on element distribution. Neither is published for these models, so the honest comparison is a demonstration on a known leak at your working distance.
Can either camera detect SF6 leaks? Both localise the ultrasound generated by a pressurised leak, and both are used for SF6 screening around GIS and switchgear. Acoustic detection does not identify the gas; it finds the turbulence. Confirming which gas is escaping, and visualising the plume, is the job of an optical gas imaging camera — see the acoustic versus optical SF6 comparison.
Which is better for partial discharge? For discharge with an acoustic path to air — corona, surface tracking, loose hardware — both are effective and the acoustic channel does the work. For internal discharge in solid or gas insulation, neither replaces a PD detector with TEV, UHF, HFCT or AE coverage.
Do I need the thermal channel at all? If your team already owns a thermal camera, no. If the survey is a combined leak-and-thermal walkdown, yes — one instrument and one pass through the plant is the entire argument for the all-in-one format.
What does the 4× super-resolution figure mean? It is a software enhancement of the displayed image, not a larger detector. It helps readability on screen; it does not add physical sampling of the scene.
What documents come with the camera? Certification documents are available, with the type, standard and report number confirmed per model and per quotation, together with the calibration document for the unit supplied. Availability and lead time are confirmed in the quotation rather than assumed.
Verdict
The GSW Series is the leak-survey instrument: 2–100 kHz of acoustic bandwidth, a 136-microphone array, 40 m laser ranging at ±1 cm, 640×512 thermal fusion and a published detection range to 130 m. It is the camera to specify when the finding has to be localised, measured and put into a leak register in a plant that is running while you survey it.
The Guide FA611S is the inspection-tablet instrument: ≤20 mK on the thermal channel, −20 to +650 °C, a 10.1″ 1920×1200 touchscreen and up to four hours of battery, with 128 microphones and a 0–65 kHz adjustable band. It is the camera to specify when the thermal pattern is the finding and two people need to agree on it on site.
If you run both kinds of work, the sequencing question is worth more than either specification: buy the acoustic capability you will use weekly, and rent or subcontract the survey you run once a year. Whichever way you go, scope the quotation against your own asset list rather than against a competitor's datasheet — that is the step where the money is actually decided.
Compare GSW and FA611S against your asset list
Send the survey type, the asset list, your typical working distance, the background-noise environment and the deliverable your client expects. We will confirm which model and configuration fits, what documents come with it, and quote it against that scope — including neutral packaging and branding options where they apply.